ReMap 2020 : Atlas of Regulatory Regions in Arabidopsis thaliana
Description ReMap 2020 Arabidopsis thaliana
This track hub represents the ReMap Atlas of regulatory regions which consists in a large scale integrative analysis of all Public ChIP-seq data (and DAP-seq) for transcriptional regulators from NCBI-GEO.
We analysed 796 quality controlled ChIP-seq/DAP-seq experiments from the GEO data wharehouse. Those ChIP-seq (n=179 TRs, n=287 Histones), DAP-seq (n=330) datasets have been mapped to the TAIR10 assembly. Here we define a “dataset” as a ChIP-seq experiment in a given series (e.g. GSE94486), for a given target (e.g. ARR1), in a particular biological condition (i.e. ecotype, tissue type, experimental conditions ; e.g. Col-0_seedling_3d-6BA-4h).
Datasets were labeled by concatenating these three pieces of information such as GSE94486.NR2C2.Col-0_seedling_3d-6BA-4h.
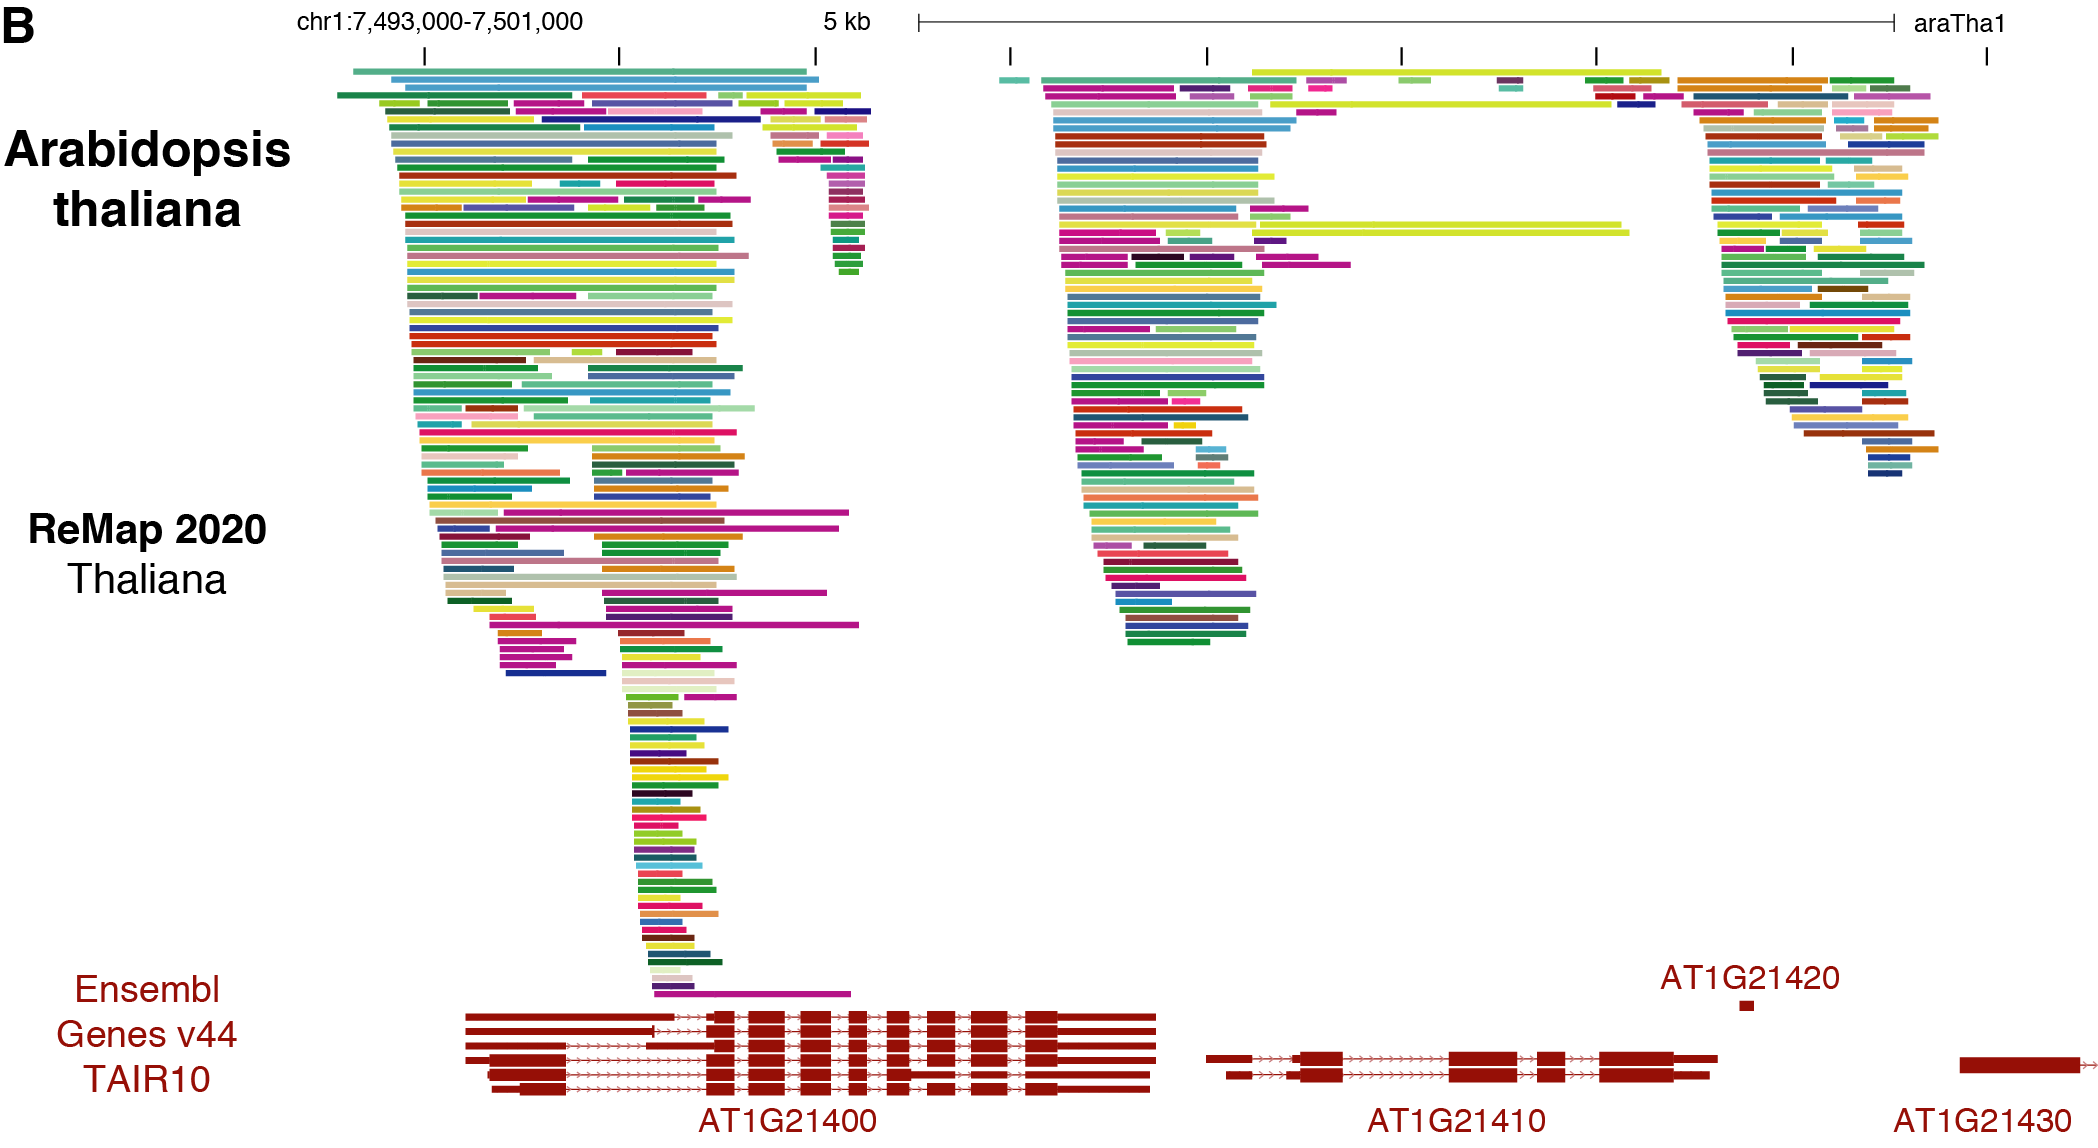
Below a schematic diagram of the types of regulatory regions availble at http://remap.univ-amu.fr/:
- ReMap 2020 Atlas
- ReMap 2020 Non redundant peaks
- ReMap 2020 Cis Regulatory Regions
Individual BED files for specific TFs, or Cells or datasets can be found and downloaded on the ReMap website http://remap.cisreg.eu or http://remap.univ-amu.fr/
Display Conventions and Configuration
-
Each transcription factor follow a specific RGB color.
-
ChIP-seq peak summits are represented by vertical bars.
-
we define a “dataset” as a ChIP-seq experiment in a given series (e.g. GSE94486), for a given target (e.g. ARR1), in a particular biological condition (i.e. ecotype, tissue type, experimental conditions ; e.g. Col-0_seedling_3d-6BA-4h).
Data sets are labelled with the concatenation of these three pieces of information (e.g. GSE94486.ARR1.Col-0_seedling_3d-6BA-4h).
Methods
Data sets sources
After consistent peak calling across datasets, we identified 1.9 million peaks bound by transcriptionnal regulators from ChIP-seq data and 0.8 million from DAP-seq data (GSE60141), giving a regulatory atlas of 2.6 million peaks. These numbers may include overlapping sites for identical TR targets which were studied in various conditions. To address this we merged overlapping TRs binding regions for similar TRs obtaining a catalogue of 1.8 million non-redundant binding sites.
Finally we also applied our pipeline to all available histone ChIP-seq data and identifed 4.5 million broad and gapped peaks.
ChIP-seq processing
Both ChIP-seq and DAP-seq data were processed similarly. Bowtie 2 (PMC3322381) (version 2.2.9) with options -end-to-end -sensitive was used to align all reads on the human genome (GRCh38/hg38 assembly). Biological and technical replicates for each unique combination of GSE/TF/Cell type or Biological condition were used for peak calling. TFBS were identified using MACS2 peak-calling tool (PMC3120977) (version 2.1.1.2) in order to follow ENCODE ChIP-seq guidelines, with stringent thresholds (MACS2 default thresholds, p-value: 1e-5). An input data set was used when available.
Quality assessment
To assess the quality of public data sets, we computed a score based on the cross-correlation and the FRiP (fraction of reads in peaks) metrics developed by the ENCODE Consortium (http://genome.ucsc.edu/ENCODE/qualityMetrics.html). Two thresholds were defined for each of the two cross-correlation ratios (NSC, normalized strand coefficient: 1.05 and 1.10; RSC, relative strand coefficient: 0.8 and 1.0). Detailed descriptions of the ENCODE quality coefficients can be found at http://genome.ucsc.edu/ENCODE/qualityMetrics.html. We used the phantompeak tools suite (https://code.google.com/p/phantompeakqualtools/) to compute RSC and NSC.
Full details of our methods can be found in the references below.
Data Availability
The ReMap BED files are available for download at the ReMap website http://remap.cisreg.eu or http://remap.univ-amu.fr/ in the download tab.
Papers to cite
-
Cheneby J., Menetrier Z., Mestdagh M., Rosnet T., Douida A., Rhalloussi W., Bergon A., Lopez F., Ballester B.
ReMap 2020: A database of regulatory regions from an integrative analysis of Human and Arabidopsis DNA-binding sequencing experiments.
Nucleic Acids Research (2020) gkz945 https://doi.org/10.1093/nar/gkz945.
-
Cheneby J., Gheorghe M., Artufel M., Mathelier A., Ballester, B.
ReMap 2018: An updated regulatory regions atlas from an integrative analysis of DNA-binding ChIP-seq experiments.
Nucleic Acids Research (2018) gkx1092 https://doi.org/10.1093/nar/gkx1092.
-
Griffon A., Barbier Q., Dalino J., van Helden J., Spicuglia S., Ballester B.
Integrative analysis of public ChIP-seq experiments reveals a complex multi-cell regulatory landscape.
Nucleic Acids Research (2015) 43 (4): e27.
Contact
If you have questions or comments, please write to:
|
|